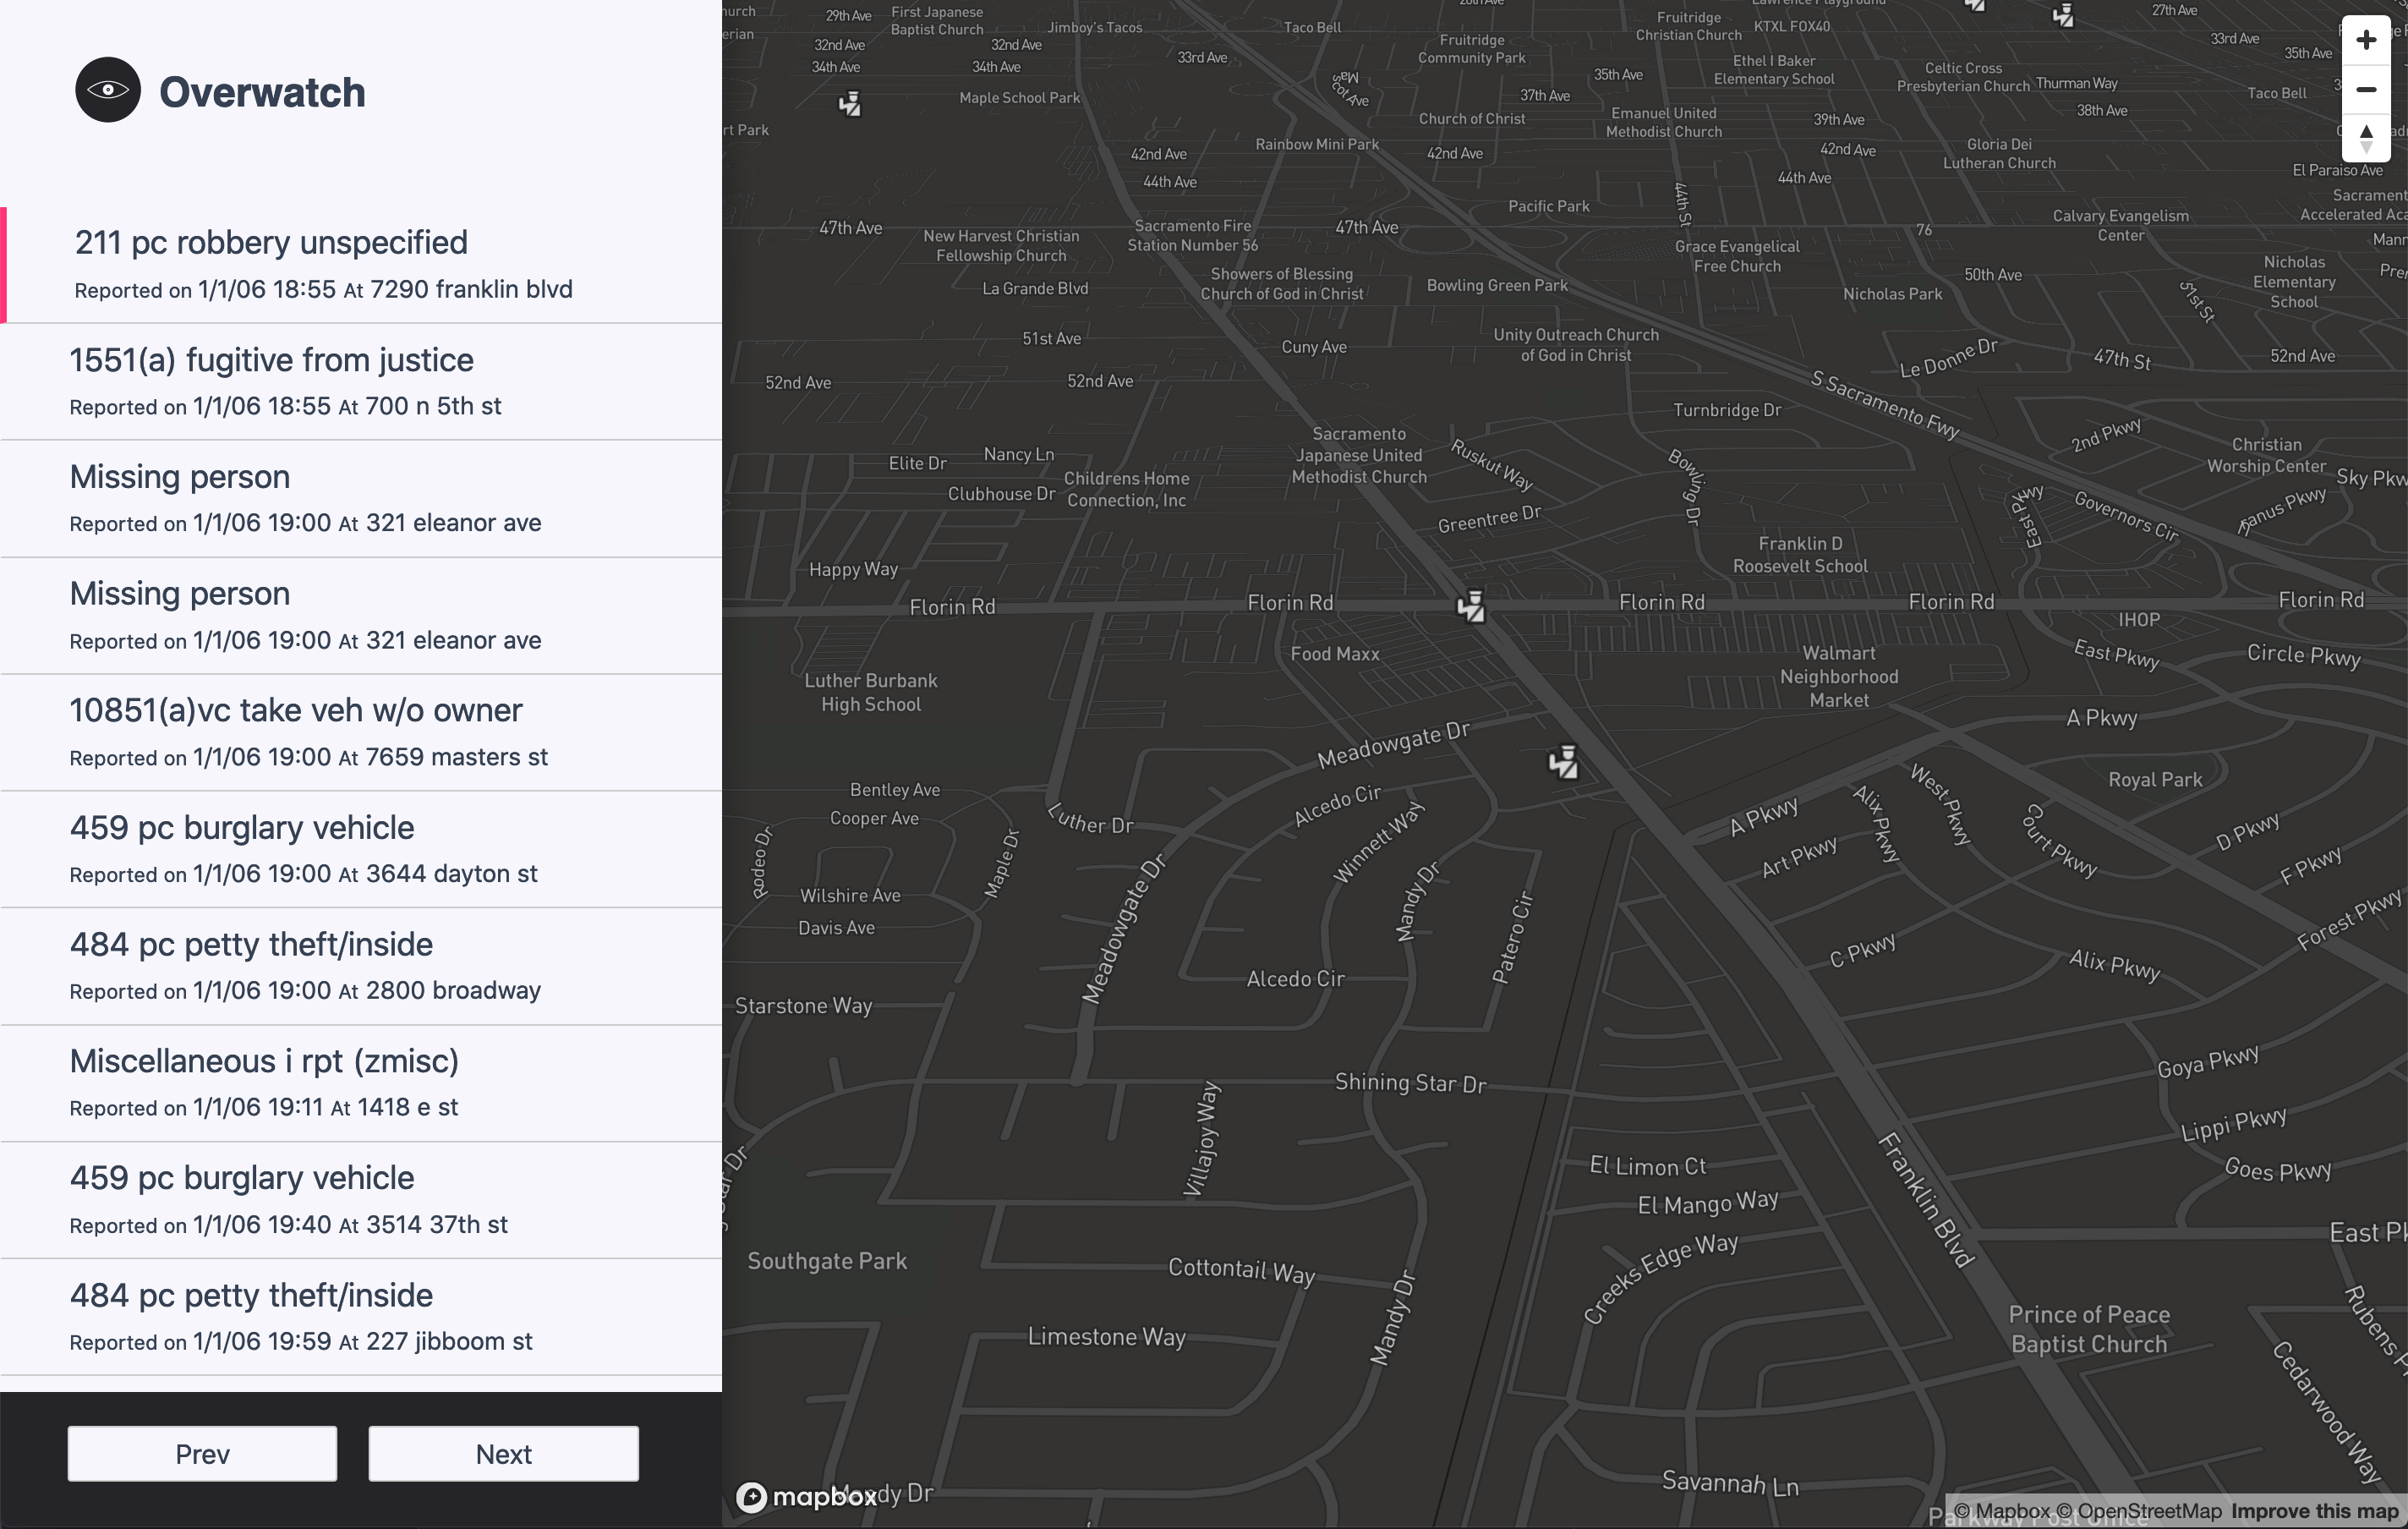
Crime Visualization
Run Project
To run the project you need Docker installed and available from your terminal.
Build Docker image:
$ ./taskfile release:dockerRun Docker container:
$ ./taskfile release:runThe application should be available in the following url:
http://localhost:1981If your docker uses an IP then replace localhost by your docker's IP e.g. http://191.168.99.100:1981
Once the web server is running you have the main page with the data visualization and this file in the following url.
Project Structure
The project consists of a backend application and a frontend client created from a template using the cr generator tool that I developed to bootstrap projects quickly.
The backend uses the core.io framework that I also developed and use for my personal projects (NOTE: I just noticed the certs in the website are expired :sad_face:)
Then frontend uses svelte and MapBox. Svelte is great in general but specifically to get something running quickly made the most sense to me.
Backend
The backend exposes an API with a single endpoint available at:
$ curl 'http://localhost:1981/api/v1/crime/sacramento?page=1&size=2' -H 'Accept: application/json' -H 'Content-Type: application/json' -H 'Authorization: Bearer 0a6fd546-9699-4fc3-8ba6-f878b11f0396'We send an authentication token otherwise we would get a 401 error however the implementation is very naive and not for real world purpose but good for the exercise.
Our response payload will look something like this:
{
  "status": true,
  "data": [
    {
      "id": 1,
      "date": "1/1/06 0:00",
      "timestamp": "2006-01-01T08:00:00.000Z",
      "address": "3108 occidental dr",
      "beat": "3C",
      "grid": 1115,
      "description": "10851(a)vc take veh w/o owner",
      "code": "2404",
      "coordinates": [
        -121.3914158,
        38.55042047
      ]
    },
    {
      "id": 2,
      "date": "1/1/06 0:00",
      "timestamp": "2006-01-01T08:00:00.000Z",
      "address": "2082 expedition way",
      "beat": "5A",
      "grid": 1512,
      "description": "459 pc  burglary residence",
      "code": "2204",
      "coordinates": [
        -121.4901858,
        38.47350069
      ]
    }
  ],
  "meta": {
    "page": "1",
    "size": "2",
    "count": 7584
  }
}
The API implements basic pagination. I wanted to implement querying and filtering but did not have enough time.
The application does not use a database, we read all data from a JSON file that the server loads on boot.
Frontend

Development
For local development you need to have Node.js v9.2.0 or higher installed.
Backend
The ./backend directory contains all server related project files.
Tests
To run tests you need to start the server first:
$ npm startYou can then run tests with the command:
$ npm test Frontend
Tasks
This projects ships with a taskfile in order to help with some tasks used during development and- in a regular project- deployments.
Tasks:
     1  data:json
     2  dev:certs:create
     3  dev:certs:keychain
     4  dev:clean
     5  dev:docker
     6  dev:frontend
     7  dev:install
     8  dev:run
     9  dev:test
    10  help
    11  release:bundle
    12  release:docker
    13  release:run
Data
We use a data set provided for this exercise as a Google spreadsheet. In order to make use of the data we export it from the Google Spreadsheets application as a CSV file. Once we have the CSV file we want to convert it to a different format, JSON in this case.
The following are the CSV headers and the inferred meaning of each:
- cddatetime: Crime date time
M/D/YY H:MM - address: Address of reported incident
- crimedescr: Normalized description of each incident consisting of a code and a short label
- latitude: Latitude
- longitude: Longitue
- district: Patrol district code
- beat: Patrol beat code
- grid: Patrol grid code
- ucr_ncic_code: *Incident reference code
City of Sacramento police records.
Environment variables
NODE_APP_PORT: 1981NODE_REPL_PORT: 9090NODE_APP_HOST: http://localhost:1981
License
® License MIT 2020 by goliatone